

Are your sales figures riding a rollercoaster throughout the year? Do you find yourself scrambling to meet unexpected demand spikes or sitting on excess inventory during slow periods? If so, you’re experiencing the very real effects of seasonality in your business – and calculating a seasonal index might be exactly what you need to get ahead of these fluctuations.
What is a seasonal index?
A seasonal index is a number that tells you how much your business performance strays from the average during specific periods when you’re forecasting seasonal demand.
These indices help you quantify the seasonal patterns that your intuition has already noticed. While you probably know summer is your busy time of year or that sales dip after the Christmas holidays, a seasonal index puts actual numbers to these patterns, making them measurable and actionable.
The beauty of a seasonal index is its simplicity – it strips away overall growth trends and random fluctuations to isolate just the particular seasons of your demand patterns. This gives you a clearer picture of what to expect.
Why do I need to forecast a seasonal index?
Inventory Management
Accurate inventory management becomes much easier with seasonal indices. When you know that December typically sees a 30% increase in orders while February drops by 15%, you can adjust your stock levels accordingly so less capital is tied up in excess inventory, and fewer disappointed customers are facing out-of-stock items.
Workforce Planning
Staffing decisions also become clearer with seasonal forecasting. Instead of hiring temporary workers at the last minute during peak times, you can plan these resources months in advance, find the right people and train them properly.
Financial Planning
Cash flow planning improves dramatically with seasonal indices as you can anticipate when your busy and slow periods will hit, you can better manage your finances and ensure you have enough capital available to stock up before peak periods.
Business Analysis
A seasonal index helps you separate the signal from the noise. When sales suddenly drop, you’ll know whether it’s just a normal seasonal dip or a genuine problem that needs addressing. This prevents knee-jerk reactions to predictable patterns.
What affects the seasonal index?
Seasonal fluctuations don’t appear out of nowhere – they’re shaped by various factors influencing your business throughout the year. If you can figure out what causes them, it will help you interpret the data better and apply your seasonal forecasts.
Weather Patterns
For a lot of businesses, the weather has a big impact on seasonal demand. Outdoor furniture sales soar in summer, while sales for fashion items like coats and scarves peak in winter. Even businesses you might not immediately associate with weather can feel these effects – retail foot traffic often drops during extreme weather events.
Holidays and Events
Important eCommerce shopping days like Christmas, Valentine’s Day, or Halloween create predictable spikes for a lot of industries. Events like back-to-school or major sporting events create their own patterns and are the most predictable parts of your seasonal index.
Consumer Behaviour Cycles
Some seasonal patterns are tied to predictable consumer behaviors throughout the year. January typically brings a surge in fitness products as people commit to New Year’s resolutions, spring sees increased interest in home improvement projects as weather improves and summer months drive travel-related purchases as the summer holidays start.
Industry-Specific Factors
Every industry has its rhythms – fashion retail follows seasonal collections, accounting services peak during tax season, and swimming pool maintenance businesses thrive in summer. Your industry’s particular characteristics will shape your specific seasonal index.
Seasonality Index Formula

Time Period Considerations
You can determine the seasonal index for different time intervals depending on your needs:
- Monthly sales(most common)
- Quarterly sales
- Weekly sales
- Daily sales (useful for restaurants or eCommerce)
The right period depends on your business cycle and how granular you need your forecasting to be.
Adjusting for Trend
For businesses experiencing growth or decline, you’ll need to account for this trend when calculating seasonal indices. Otherwise, growth might be mistakenly blamed on seasonality.
How to Calculate Seasonal Index Formulas
Step 1: Gather Historical Data
For example, for a beachwear business that wants to work out seasonal variations over time, we’ve created a spreadsheet of monthly sales data for the past 3 years. This is our time series data – information collected at regular intervals over time:
| Month | 2022 Sales | 2023 Sales | 2024 Sales |
| Jan | £5,000 | £5,200 | £5,400 |
| Feb | £6,000 | £6,200 | £6,500 |
| Mar | £8,000 | £8,500 | £9,000 |
| Apr | £10,000 | £10,500 | £11,000 |
| May | £15,000 | £15,800 | £16,500 |
| Jun | £20,000 | £21,000 | £22,000 |
| Jul | £25,000 | £26,000 | £27,000 |
| Aug | £18,000 | £19,000 | £20,000 |
| Sep | £12,000 | £12,500 | £13,000 |
| Oct | £8,000 | £8,300 | £8,600 |
| Nov | £7,000 | £7,300 | £7,600 |
| Dec | £9,000 | £9,500 | £10,000 |
You can also calculate with different data values like sales for specific items or collections.
Step 2: Calculate Period Averages
Now we calculate the average sales for each month across all three years:
| Month | Average Sales |
| Jan | £5,200 |
| Feb | £6,233 |
| Mar | £8,500 |
| Apr | £10,500 |
| May | £15,767 |
| Jun | £21,000 |
| Jul | £26,000 |
| Aug | £19,000 |
| Sep | £12,500 |
| Oct | £8,300 |
| Nov | £7,300 |
| Dec | £9,500 |
Step 3: Calculate the Grand Average
For our beach shop, the grand average of all monthly averages is: (£5,200 + £6,233 + … + £9,500) ÷ 12 = £12,483
Step 4: Calculate the Seasonal Index
Now we divide each month’s average by the grand average and multiply by 100:
| Month | Calculation | Seasonal Index |
| Jan | (£5,200 ÷ £12,483) × 100 | 42 |
| Feb | (£6,233 ÷ £12,483) × 100 | 50 |
| Mar | (£8,500 ÷ £12,483) × 100 | 68 |
| Apr | (£10,500 ÷ £12,483) × 100 | 84 |
| May | (£15,767 ÷ £12,483) × 100 | 126 |
| Jun | (£21,000 ÷ £12,483) × 100 | 168 |
| Jul | (£26,000 ÷ £12,483) × 100 | 208 |
| Aug | (£19,000 ÷ £12,483) × 100 | 152 |
| Sep | (£12,500 ÷ £12,483) × 100 | 100 |
| Oct | (£8,300 ÷ £12,483) × 100 | 66 |
| Nov | (£7,300 ÷ £12,483) × 100 | 58 |
| Dec | (£9,500 ÷ £12,483) × 100 | 76 |
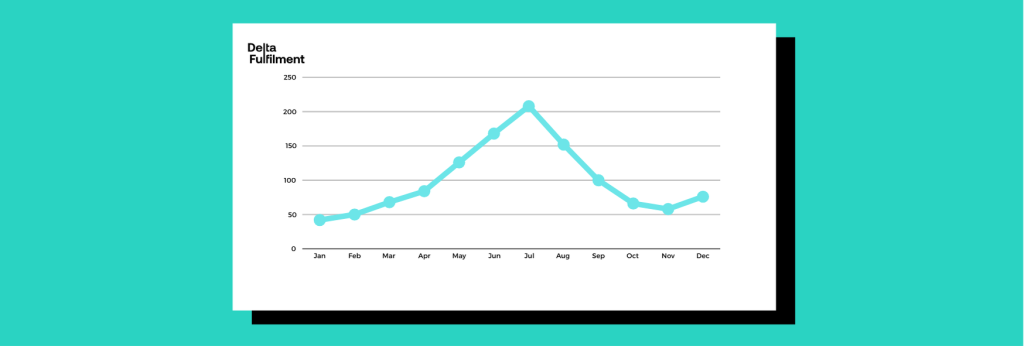
Or you can plot this on a graph:
What These Numbers Actually Mean
These seasonal indices tell us exactly how each month performs relative to an average month:
- An index of 100 means that the month is exactly average (September in our example)
- Indices above 100 indicate high-performing months (May through August)
- Indices below 100 show below-average months (October through April)
The magnitude shows how extreme the seasonality is:
- July’s index of 208 means it performs more than twice as well as an average month
- January’s index of 42 means it only achieves 42% of what an average month does
There are no “good” or “bad” indices – they’re simply measurements. Even low indices are valuable because they help you plan accordingly. Knowing January will be slow allows you to reduce inventory and staffing costs during that period.
Step 5: Verify Your Results
When we add up all our seasonal indices and divide by 12, we get: (42 + 50 + … + 76) ÷ 12 = 100, which confirms our calculations are correct.
Step 6: Deseasonalised Data
Sometimes, you need to smooth or deseasonalise your time series data to identify underlying trends. By dividing each actual value by its corresponding seasonal index (and multiplying by 100), you remove the seasonal component, so you can see the actual business growth or decline without seasonal effects clouding the picture.
Deseaonalised Data = Actual Sales ÷ Seasonal Index
For example, if July 2024 sales were £27,000, its deseasonalised value would be: £27,000 ÷ (208 ÷ 100) = £12,981
This tells us that after accounting for July’s typical seasonal boost, the underlying business level is around £12,981 – very close to our average monthly figure.
Step 7: Apply to Forecasting
Let’s say our baseline forecast for January 2025 (without seasonality) is £6,000.
Using our seasonal index: Seasonally adjusted forecast = £6,000 × (42 ÷ 100) = £2,520
This makes sense since January is typically only 42% of an average month for our beach shop.
Common Challenges of Seasonal Forecasting
Handling Short-Term Trends
Seasonal patterns can sometimes be masked or amplified by short-term trends. For example, an unusually hot spring pulls summer sales forward, temporarily confusing your usual formula. If this happens, make sure you regularly recalculate.
Dealing with Limited Data
If your business is relatively new, you might not have enough historical data for reliable seasonal calculations. In these cases, industry benchmarks or similar business patterns can provide a starting point until you build your own history.
Accounting for Changing Seasons
Climate change and shifting buyer behaviours mean these patterns aren’t always set in stone. What worked five years ago might be slightly different today, so regularly updating your seasonal analysis makes sure you stay aligned with current patterns.
Exceptional Events
Unpredictable events like the COVID-19 pandemic can completely disrupt normal trends and seasonality. When you’re calculating indices, you might need to rule out specific irregular periods or use statistical techniques to identify and adjust for outliers.
Advanced Techniques
More sophisticated techniques may be needed for businesses with complex seasonal patterns. Moving averages and regression analysis can help separate seasonal effects from trends and random fluctuations with better accuracy.
Let Delta Fulfilment Take the Complexity Out of Your Seasonal Planning
We know it can feel overwhelming when you’re already juggling the day-to-day demands of running your business and calculating demand and trends. That’s where Delta Fulfilment comes in.
Our team of supply chain experts specialises in helping businesses just like yours navigate the complexities of demand. We don’t just store and ship your products – we partner with you to understand your seasonal patterns and optimise your fulfilment strategy.
With Delta Fulfilment, you’ll benefit from:
- Expert inventory management that adjusts to your seasonal fluctuations
- Flexible warehouse space that scales with your needs throughout the year
- Advanced forecasting tools that help predict and prepare for annual shifts
- Experienced staff who understand how to handle peak season rushes
Don’t let seasonality catch you off guard. Contact Delta Fulfilment today and discover how we can help transform seasonal challenges into year-round success.